VeselovAlex.github.io
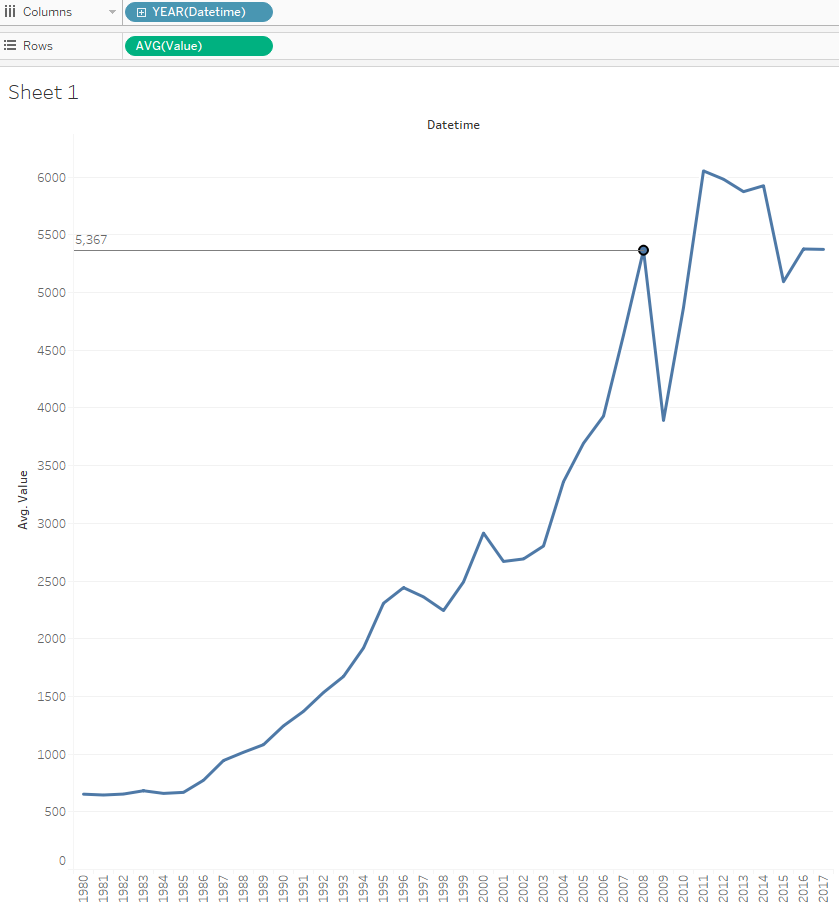
Average by Year for One Metric
Overview
Let’s build a report illustrating average monthly imports each year.
Data Source
- Table:
bi.im_net1.m
Steps
- Drag-and-drop the table to Canvas area
- Press Sheet 1
- Press OK to acknowledge the warning about limitations
- Drag-and-drop Datetime onto the columns field.
- Drag-and-drop Value onto the rows field.
- Change value aggregation from SUM to AVG: right click > Measure > Average
- Select Line in the dropdown on Marks Card
- Optionally add drop lines
Results