VeselovAlex.github.io
Detailed Values by Date (No Aggregation) for Two Metrics
Overview
Build a report displaying two metrics in one workspace.
Data Source
- Tables:
bi.ex_net1.mandbi.im_net1.m
Steps
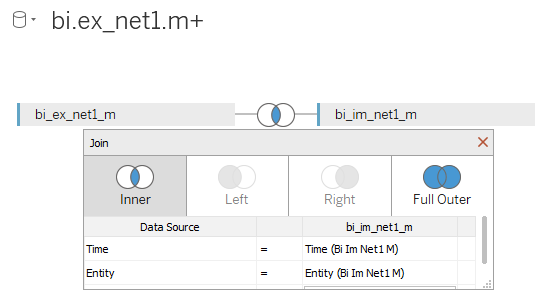
- Drag-and-drop both tables to Canvas area
- Select Inner Join, specify Time and Entity as equal fields:
- Press Sheet 1
- Press OK to acknowledge the warning about limitations
- Drag-and-drop Datetime onto the columns field (you can use any of Datetime), change from YEAR aggregation to Exact Date
- Drag-and-drop both Value onto the rows field, change from SUM aggregation to Dimension
- Specify color: Marks > Value (you can use any of Value) > Color
- Specify shape: Marks > Value (you can use any of Value) > drop-down > Shape
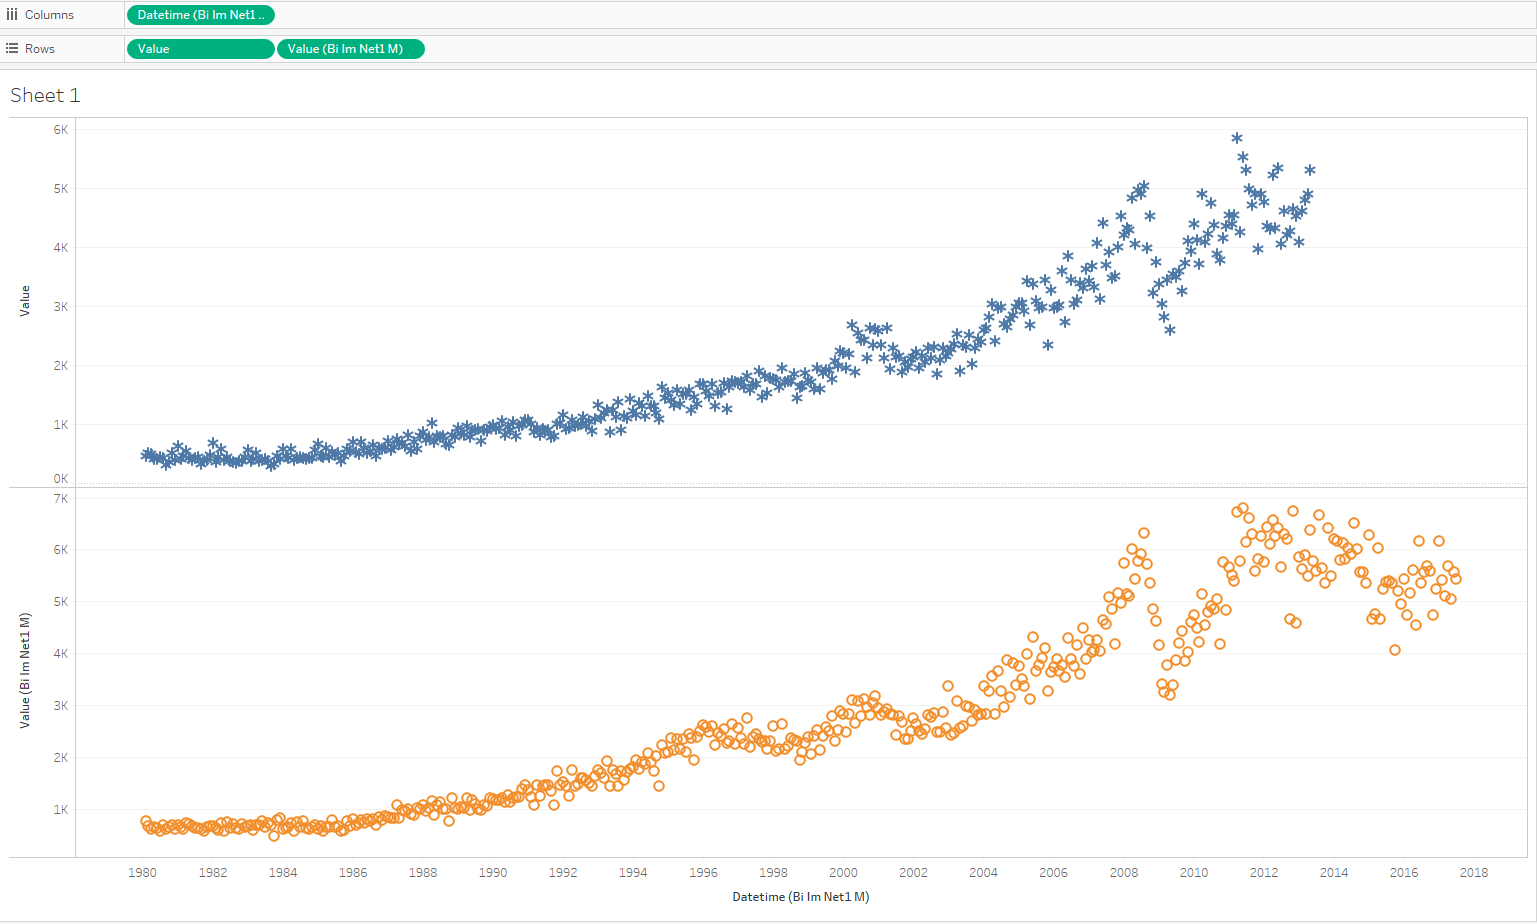
Results
Compare the two metrics: