VeselovAlex.github.io
MIN and MAX by Year for One Metric
Overview
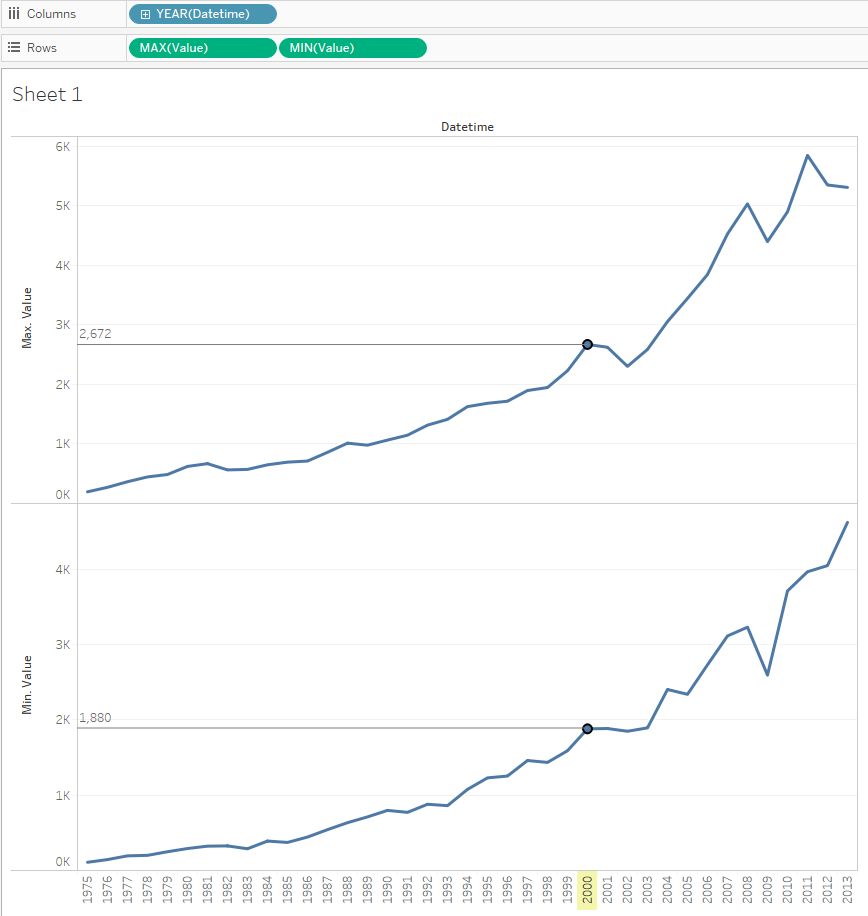
Report comparing minimum and maximum exports per year.
Data Source
- Table:
bi.ex_net1.m
Steps
- Drag-and-drop the table to Canvas area
- Press Sheet 1
- Press OK to acknowledge the warning about limitations
- Drag-and-drop Datetime onto the columns field
- Drag-and-drop Value onto the rows field, change aggregation from SUM to MIN: right click > Measure > Minimum
- Drag-and-drop Value onto the rows field, change aggregation from SUM to MAX: right click > Measure > Maximum
- Select Line in the dropdown at the All section on Marks Card
- Optionally add drop lines
Results