VeselovAlex.github.io
MONTH and YEAR aggregation
Data Source
- Table:
bi.ex_net1.m
Steps
- Drag-and-drop the table to Canvas area
- Press Sheet 1
- Press OK to acknowledge the warning about limitations
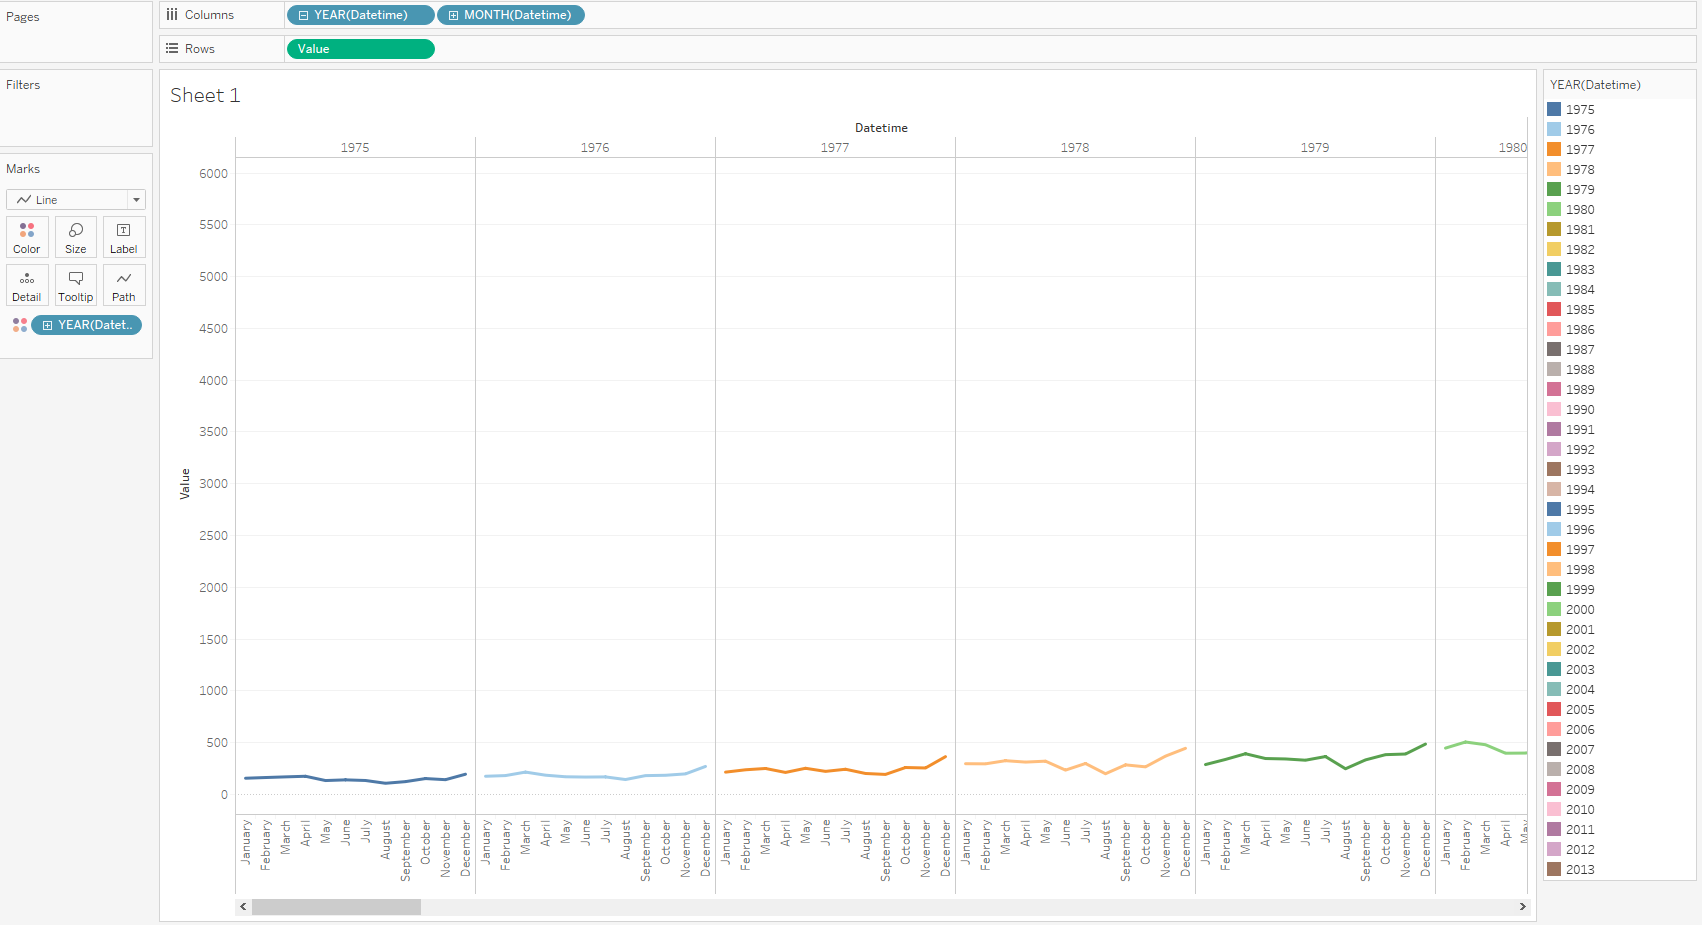
- Drag-and-drop Datetime onto the columns field and Value onto the rows field
- Value > Right-click > Dimension
- Marks Card > Drop-down > Line
- YEAR > +, right click on the QUARTER > MONTH
- Drag-and-drop Datetime to the Color (Marks Card), select Add all members
Results
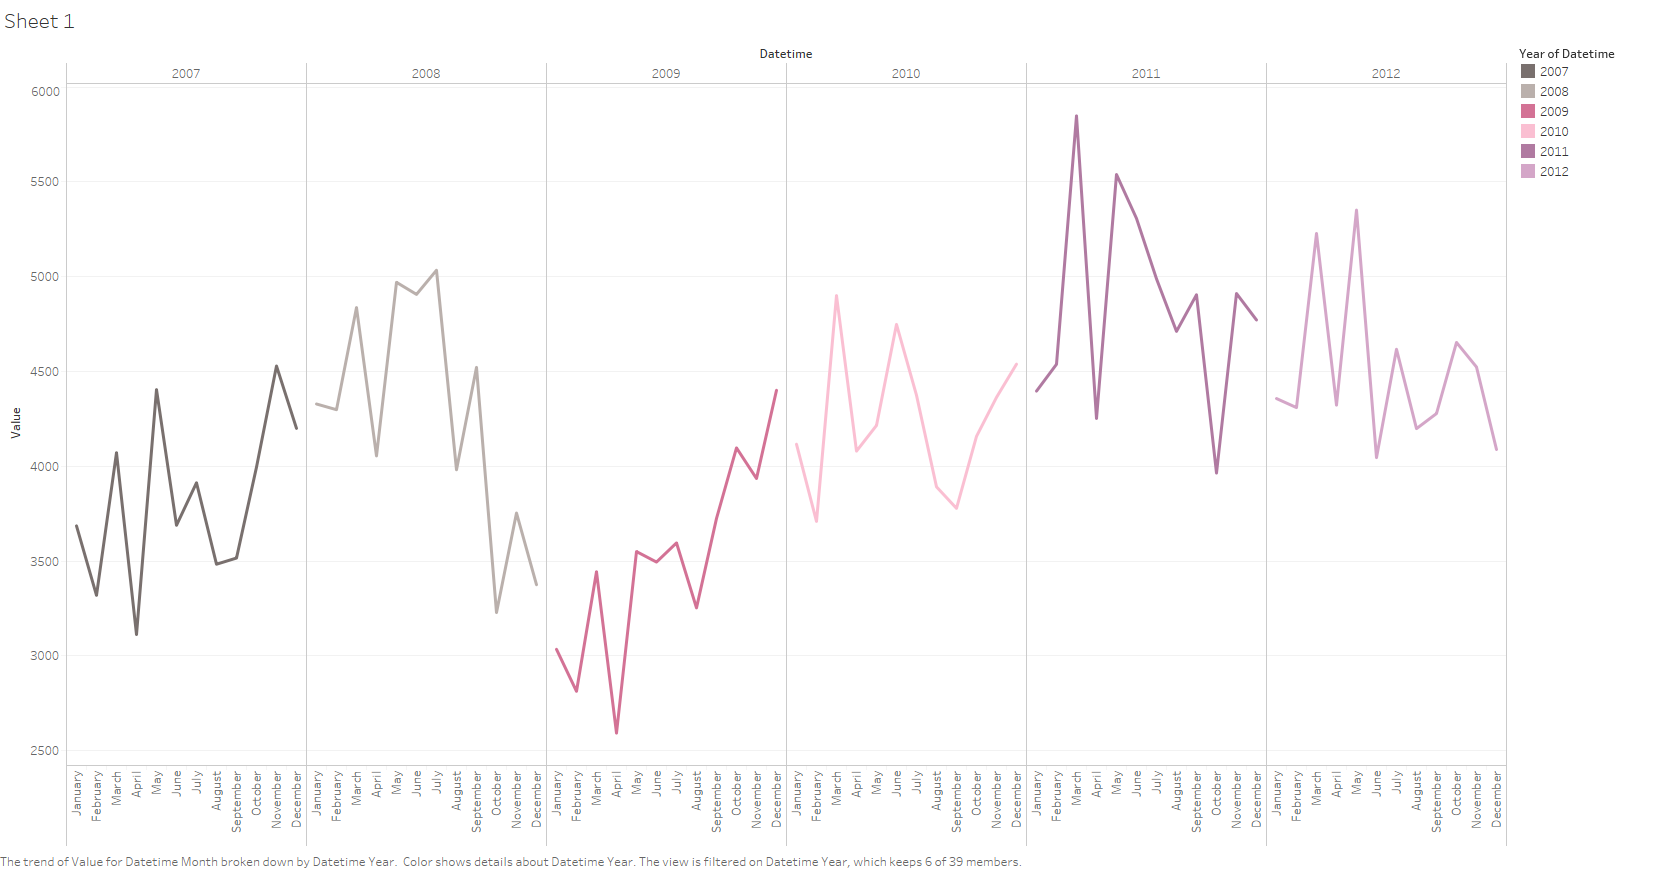
Review statistics for years 2007-2012:
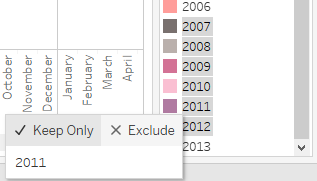
- Select 2007-2012 rows in YEAR(Datetime) Card (right side of the window) > Keep Only
View results: