VeselovAlex.github.io
Value Aggregation
Overview
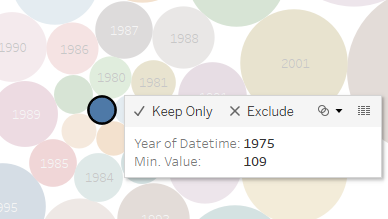
Display the minimum exports each year.
Data Source
- Table:
bi.ex_net1.mSteps
- Drag-and-drop the table to Canvas area
- Press Sheet 1
- Press OK to acknowledge the warning about limitations
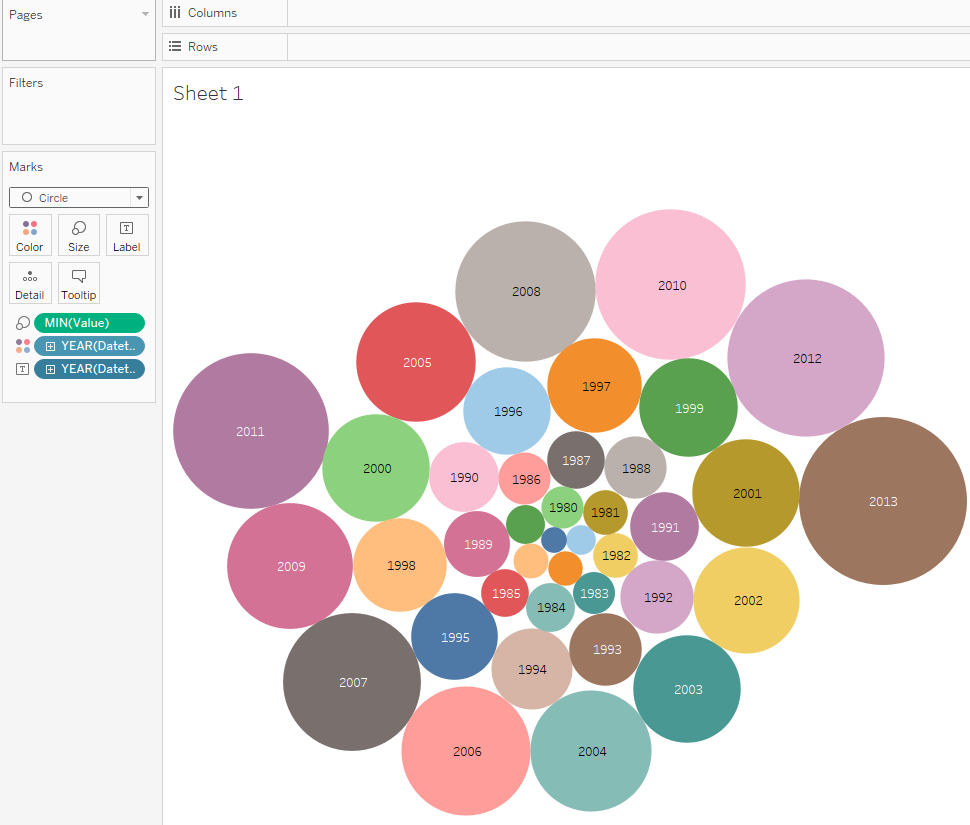
- Drag-and-drop Value to the Marks Card, right click > Measure > Minimum, replace Detail with Size
- Drag-and-drop Datetime to the Marks Card, replace Detail with Color
- Drag-and-drop Datetime to the Marks Card, right-click on the QUARTER > YEAR, replace Detail with Label
- Change Automatic to Circle in the dropdown at Marks Card
Results
We can see that in 1975, the value was equal to 109 and it is the absolute minimum among all measures in the bi.ex_net1.m metric: